
Your Guide to Account Tiering with Beauhurst
Company data platforms can be used for a number of commercial uses, including lead scoring, finding new companies based on your ICP, and enriching your CRM with high-quality data. But one of the key uses of firmographic data is account tiering and segmentation. And while you may not have heard that term, it can be called a number of different things such as territory prioritisation, lead scoring, company sizing — the list goes on. Every team uses its own lingo but for this article we’ve primarily used the term account tiering.
In this article we’ll dive into all the different data points available on the Beauhurst platform to help your team map out small, medium, and large companies — and how to use them effectively for segmentation purposes.
We’ll also highlight key data points available on the platform that can help you assign higher or lower priority to your teams’ accounts.
Why you should be account tiering
BD fails without prioritising leads
The main reason to do account segmentation is productivity and efficiency. This means making sure the right leads go to the right parts of the business, where the right resource and skill can be made use of, ensuring no potential opportunities are wasted, while conversion rates and contract value are maximised.
Without doing this, companies will trend towards lower conversion rates, a poor customer experience, and often disgruntled reps. This is where account segmentation and tiering come in, helping you navigate the complexities of working with companies of different sizes, and prioritise the right accounts.
However, getting the right data in place is vital to creating a reliable segmentation process or account tiering list. Without data you can rely on, your sales reps can’t properly forecast the value of opportunities, leading to a lack of adoption and trust in the data.
Key data points for identifying companies by size
Avoiding small deals and “we have no budget”
Revenue
Turnover, or revenue, is often used as a means of tracking businesses’ performance. It offers a clear, quantifiable view of business scale — particularly at the medium and larger end of the market.
When available, revenue can help you benchmark company size, assess commercial potential, and understand whether a business is growing, stagnant, or in decline. It’s also one of the few indicators that allows for like-for-like comparisons across sectors, provided you’re interpreting it within the context of a company’s broader financial figures.
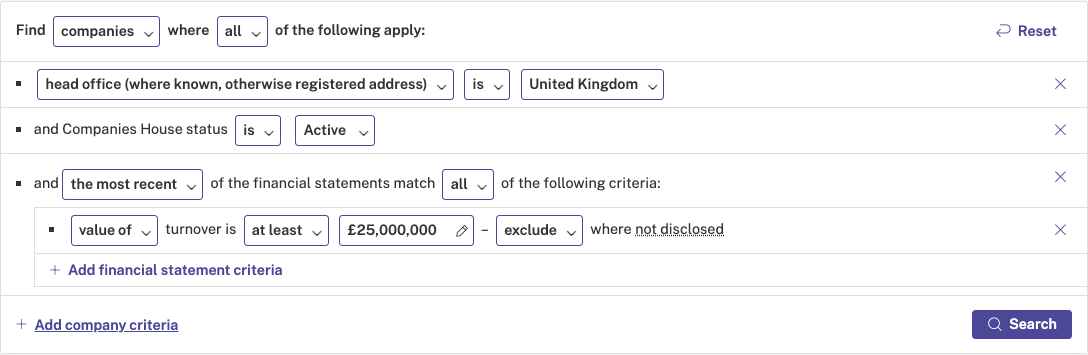
Finding UK companies using the Beauhurst platform with minimum £25m revenue
There is a limitation with using revenue as a metric, however. The smaller the company, the less publicly available the data will be. This is because some companies are exempt from filing turnover figures. These are defined by businesses with at least two of the following characteristics:
- an annual turnover of no more than £15 million
- a balance sheet total of no more than £7.5 million
- no more than 50 employees on average
Therefore, you’re much less likely to get complete turnover figures for revenue less than £15m. You can read more about these exemptions at gov.uk.
And in late 2024, the UK Government confirmed that it will be amending company size thresholds too, reducing the regulatory burden for small businesses but also impacting available data.
Headcount
Choosing thresholds for headcount varies greatly depending on what you sell, and who you sell it to. But, as a rule of thumb, companies under 50 employees can be considered a small company, 50-499 is how you might identify a mid-market company, whilst 500+ is likely to be a large corporate.
Definitions around company size and threshold tend to vary based on industry and location, but headcount data on Beauhurst is a sure-fire way to distinguish between small, medium, and larger companies in your target industries.
While this is often a reliable metric for traditional industries, the advent of AI is starting to tick towards leaner teams with more robust financials at an early stage, so could be misrepresentative of their potential value to your business. However, the industry that the company is in can often provide further context to aid you in this” and/or “in emerging industries, headcount doesn’t always correlate with output / potential sales value of a company.
Industry
Segmenting companies by industry on Beauhurst is simple, and can help you target companies more likely to be facing the challenges that your product or service can solve.
This keeps you close to your ICP. It’s also hugely important if your team operates on a verticalised basis, or if your company goes to market with multiple products and needs to tailor your messaging at scale.
It also contextualises the datapoints listed above. For example, an AI company with £10m in revenue and a headcount of 10 people might be operating with bleeding-edge, highly scalable technology. Whereas a law firm with a headcount of 300, generating £20m turnover, may reflect a more traditional business model. Both are successful in their own right, but industry data can help shape what those figures might mean in practice.
Other company data platforms simply pull in Standard Industrial Classification (SIC) codes from Companies House to classify a company’s business activity, but we’ve found these to be an unhelpful way of explaining what businesses in the 21st century actually do.
For example, under SIC codes, SaaS, app development, and server software all fall under a single umbrella term: Software Development (62012). It’s vague, dated, and doesn’t offer any meaningful clarity on the company’s offerings.
Our Industries classifications include 84 buzzwords and 224 industries, ensuring you can pinpoint the precise businesses you want to work with. Beauhurst’s proprietary industry classification covers millions of companies, with detailed sectors mapping the whole economy; from FinTech to furniture making, carbon capture to catering.
Without this datapoint, many tiering & segmentation plans fall apart. This is because reps or RevOps teams are forced to correct, or manually populate, sector codes for themselves. This leads to time spent doing unnecessary data entry, or disregarding the segmentation or account tiering list entirely.
Map the Entire Economy with Beauhurst
Location
You can learn a lot about a company by its location(s).
Location data can be also incredibly valuable when segmenting and qualifying companies — especially for sales teams looking to assign territories, route leads efficiently, or understand jurisdictional regulation and tax.
- Small businesses are often limited to a single office or home/registered address.
- Medium companies may, in addition to its headquartered location, also have a number of regional hubs or trading addresses.
- Large companies are relatively easy to spot. In addition to their headquarters, they’ll likely have a number of trading addresses, perhaps even international ones.
Getting accurate location data is key for a number of reasons. Without it, you risk missing companies from a rep’s territory altogether — or assigning them to the wrong one.
For example, field sales teams won’t thank you for sending them to a prospect’s accountant or registered office — they want to be visiting the company’s actual operational base, where decision-makers are likely to be.
As always, it’s worth urging caution in making assumptions based on this data set alone. A tech company is often more inherently scalable than a manufacturing company, and having multiple rented premises isn’t always necessary. Likewise, a company with a global presence doesn’t make it profitable.
Instead, use this data in conjunction with other data sets such as turnover, employee count and industry to build a more accurate picture to guide you.
EBITDA
While not necessarily the go-to benchmark for the scale of a business, this is still a useful metric for segmentation where efficiency and profitability are important identifiers in your target market. EBITDA — earnings before interest, tax, depreciation, and amortisation — can be a useful benchmarking tool for a business’s operational efficiency and profitability, though its usefulness will depend on the size of the business.
EBITDA data for small companies is often unavailable due to lack of mandatory public financial reporting. And even when it is available, EBITDA figures for small companies can be misleading due to early-stage businesses sometimes operating at a loss, or reinvesting, whilst scaling.
Medium-sized companies are more likely to report EBITDA as their regulatory responsibilities increase in line with public accounting responsibilities. A healthy EBITDA margin for a mid-sized company can suggest the business is entering a more stable, scalable phase.
EBITDA data for large Companies is always reported in filings or annual reports, making it a highly valuable form of data for account tiering your higher-value prospects.
However, it’s always worth using EBITDA as a point of guidance. Comparing it with headcount and revenue data is vital to ensure that the company is growing organically, as opposed to masking cost-cutting measures.
How to Find Mid-Market Corporates on Beauhurst
Other key data points for prioritising accounts
Small companies
Founder data
Founder data can offer some great insights into how successful an early-stage company could be.
Reviewing the backgrounds of founders, such as where they’ve worked, what ventures they’ve previously launched, and how successful those were, can help you qualify companies that are more likely to scale.
Repeat founders with prior exits or growth stories often bring a level of experience, investor trust, and network access that sets their new ventures apart.
By properly evaluating a founder’s track record, your team can identify high-potential businesses earlier — and focus their time on companies with stronger strategic foundations.
Signals
Growth Signals such as funding rounds, venture debt, or accelerator attendance are strong indicators that a company is gaining momentum.
There is value to looking beyond these indicators too though. For example, has the company’s valuation significantly increased between rounds, or does it appear to have plateaued? Which funds are investing? If they’re backed by high-profile venture firms, or angel investors with a track record in the sector, that’s a positive sign.
Other signals, like a hiring spree — especially into product, sales, or leadership roles — can suggest that the company is preparing to scale. When reviewed in context, these indicators can reveal a great deal about a business’s short to medium-term priorities.
Likewise, Innovation Signals such as patents, R&D grants, or confirmation of academic spinout status can signify a company to rank higher in your account tiering process.
IP-rich companies also tend to see much more rapid growth trajectories. This is because innovative, IP-intensive businesses often seek larger funding rounds before growing rapidly to scale. Both of these factors make them inherently more valuable accounts in your segmentation strategy.
Finally, Risk Signals such as down rounds or short cash runway can help your team identify potential areas of risk in early-stage companies. It’s worth noting that a risk signal doesn’t mean you shouldn’t engage with a company — but it’s a cue for your team to investigate further.
Medium companies
Company maturity
Signals
Growth Signals such as high growth list appearances, or 20% scaleup status, can point to the challenges of a scaling business, where tools & services that they have historically used are no longer fit for purpose — and therefore more likely to be open to discussing your services.
On Beauhurst, you can use financial figures and changes, valuation data, debt rounds, and headcount growth to assess the maturity and trajectory of these businesses.
Innovation Signals like R&D expenditure or grant funding, which suggest a company is actively investing in new technologies, products, or processes, are also valuable data points. Increased R&D activity among these companies can sometimes indicate bigger initiatives, such as new product lines, which might be useful for prioritising accounts.
At the same time, Risk Signals like CCJs or a down round may signal financial instability or operational challenges. Again, these aren’t an indicator to deprioritise a company — but they do provide context for broader commercial conversations and account planning.
Large companies
The number and structure of a company’s legal entities can offer a powerful lens for segmentation, ensuring your most experienced sales reps are working the most complex accounts, and aware of the challenges they might face.
Businesses with multiple entities are invariably more complex in nature, perhaps part of a wider group of companies, operating across multiple jurisdictions, or managing different business functions under distinct legal umbrellas.
Signals
For large companies, Signals become particularly useful when you need to cut through complexity and identify strategic priorities.
Growth Signals include acquisitions — a strong sign that the business is in an expansion phase and more open to new suppliers, partnerships, or services to help scale with that growth.
Even at the top end of the market, Risk Signals have value. Although rare, large businesses can experience cash flow issues in the form of a short runway, restructuring, or market challenges such as a down round.
See the data in action
Whether you’re looking for promising early-stage startups, fast-growth mid-market companies, or enterprise-level businesses, you need access to high-quality data via Beauhurst.
To see the data in action, you can now take a quick tour of the platform. Or, to talk to the team, book a demo using the form below.
Discover our data.
Get access to unrivalled data on the companies you need to know about, so you can approach the right leads, at the right time.
Schedule a conversation today to see all of the key features of the Beauhurst platform, as well as the depth and breadth of data available.
We’ll work with you to build a sophisticated search, returning a dynamic list of organisations that match your ideal customer profile.
Beauhurst Privacy Policy