A framework for mapping a regional startup ecosystem
So, how do you turn these different datasets into something useful?
Step 1: Define the boundary (administrative geography, functional economic geography, or hybrid)
Start with the question the mapping exercise needs to answer.
If it supports statutory reporting or funding allocation, an administrative boundary may make most sense. If the aim is understanding a technology cluster, a functional economic geography could be more useful.
Document this definition so that the methodology remains consistent when the exercise is repeated.
Step 2: Build the company universe using company data
Next, identify the companies that meet your geographic and startup criteria.
This is the foundation of the map. Rather than starting with a list of well-known businesses and adding companies manually, work from a comprehensive private company dataset and filter down. That reduces selection bias and makes it easier to discover companies that haven’t yet attracted significant press or investment.
Step 3: Layer in funding, growth, and outcome data
Add company performance to your initial universe. Useful indicators might include fundraising, headcount growth, turnover, grants, acquisitions, initial public offerings (IPOs), and company status.
Negative outcomes matter too. Dissolutions and unsuccessful companies provide important context when assessing the health of an ecosystem.
Step 4: Map the enablers (accelerators, universities, investors, corporate partners)
Identify the organisations surrounding those companies. Depending on the region, this could include universities, accelerators, incubators, investors, local authorities, science parks, research institutes, and major corporate partners.
Look beyond their presence to their involvement with companies in your dataset.
Step 5: Identify clusters and specialisations using sector classification and buzzwords
Standard industry classifications alone rarely capture emerging sectors particularly well.
DSIT’s own Innovation Clusters Map illustrates this challenge. Its methodology combines Standard Industrial Classification data with sector lists and more dynamic Real-Time Industrial Classifications to identify activity in emerging areas such as quantum technology, advanced materials, and robotics.
Combining sector classifications with more granular company descriptions and buzzwords can similarly reveal concentrations in areas such as clean energy, artificial intelligence, or advanced materials.
Look at several indicators together. A genuine cluster might show not only a high number of relevant companies, but also investment, research activity, spinouts, and specialist infrastructure.
Step 6: Benchmark against peer regions
Numbers without context can be misleading. The British Business Bank’s Nations and Regions Tracker 2025 also found that London’s share of UK equity investment fell from 73% in 2020 to 61% in 2024, while several regions recorded growth. But even apparently impressive regional investment figures need interrogating.
Beauhurst’s analysis of the regional investment gap provides a useful example. In Q3 2025, Edinburgh-based Fidra Energy raised £445m. That single deal represented almost 80% of Scotland’s total investment value for the quarter, while the actual number of Scottish deals fell 13%. A headline total could therefore suggest a very different trajectory from the underlying ecosystem.
Select comparable regions and apply the same methodology to each. Comparisons could include startups per capita, deal numbers and value, spinout formation, high-growth company density, sector concentration, or the proportion of businesses progressing to later funding stages.
Using the same underlying dataset and definitions is essential for meaningful regional startup benchmarking in the UK.
Step 7: Publish, refresh, and rebuild the picture on a regular cadence
Finally, decide how the map will be maintained. Core metrics might be reviewed quarterly, with a more comprehensive annual report used to examine longer-term trends.
The important thing is to avoid rebuilding the entire exercise from scratch each time. Maintain the underlying company universe and update it as companies form, grow, move, fundraise, exit, or dissolve.
What to include in a regional startup ecosystem report
The exact metrics will depend on the purpose of your report, but there are several areas worth covering.
Headline company count and year-on-year change
Show the overall number of startups and scaleups, but put that number in context. How has the population changed from the previous year? How many companies are new to the dataset, and how many have left it?
Sector distribution and cluster identification
Break the company population down by industry and identify areas of concentration. Where possible, look beyond broad classifications to identify emerging specialisms that might otherwise be hidden inside larger sectors.
Capital raised (over time, by stage, by sector)
Show both the value and number of funding rounds, preferably over several years.
Breaking this down by stage and sector helps distinguish between broad-based investment growth and totals driven by a handful of exceptionally large deals.
Top investors and investor concentration
Identify which investors are most active in the region and where they are based.
Investor concentration can also reveal whether an ecosystem depends heavily on a small group of funders or has access to a more diverse capital base.
University spinout activity and knowledge-exchange indicators
Track the number of spinouts, their sectors, investment activity, and growth.
Universities may also want to examine connections between their institution and the wider business ecosystem, including partnerships and other knowledge-exchange activity.
Accelerator and incubator involvement
Identify which programmes local companies have participated in and whether particular accelerators appear repeatedly among successful businesses.
This can help regional bodies understand which pieces of support infrastructure are most embedded in the ecosystem.
Exit outcomes and survivorship
Don’t only measure success stories. Acquisitions, IPOs, and other exits are important, but so are company dissolutions and failures. Including both helps avoid survivorship bias and creates a more realistic picture of company progression.
Notable companies and case studies
Finally, bring the data to life. Case studies can demonstrate what broader trends look like at company level, whether that is a university spinout raising its first institutional round or a startup progressing through the region’s support infrastructure into a scaleup.
Common pitfalls in regional ecosystem mapping
Even a data-rich ecosystem map can give a misleading picture if the methodology is inconsistent.
Boundary that’s too narrow (missing companies that operate in the region but are registered elsewhere)
Relying solely on registered headquarters can exclude companies with meaningful operations in the region.
Consider operating locations alongside registered addresses and document how each is treated within the methodology.
Boundary that’s too broad
The opposite problem can occur when boundaries extend so far that meaningful local characteristics disappear.
Choose a geography that reflects the purpose of the analysis rather than simply maximising the number of companies included.
Relying on stale data or one-off snapshots
Company ecosystems change quickly. Funding rounds close, startups relocate, new companies emerge, and existing businesses change direction. A static dataset gradually becomes less representative of what is happening on the ground.
Missing dissolutions and exits
Tracking only companies that continue to operate creates an artificially positive picture.
Include dissolved companies, acquisitions, and other outcomes so that the analysis reflects the full company journey.
No benchmark or peer comparison
A number rarely tells you whether performance is good or bad in isolation.
Benchmarking against comparable areas makes it possible to distinguish genuinely unusual regional performance from wider UK trends.
Publishing once, then not refreshing
A regional ecosystem report should ideally be an output of the intelligence process rather than the intelligence process itself.
Maintain the underlying dataset so that the next report updates the existing picture rather than starting again.
How Beauhurst powers regional startup ecosystem mapping
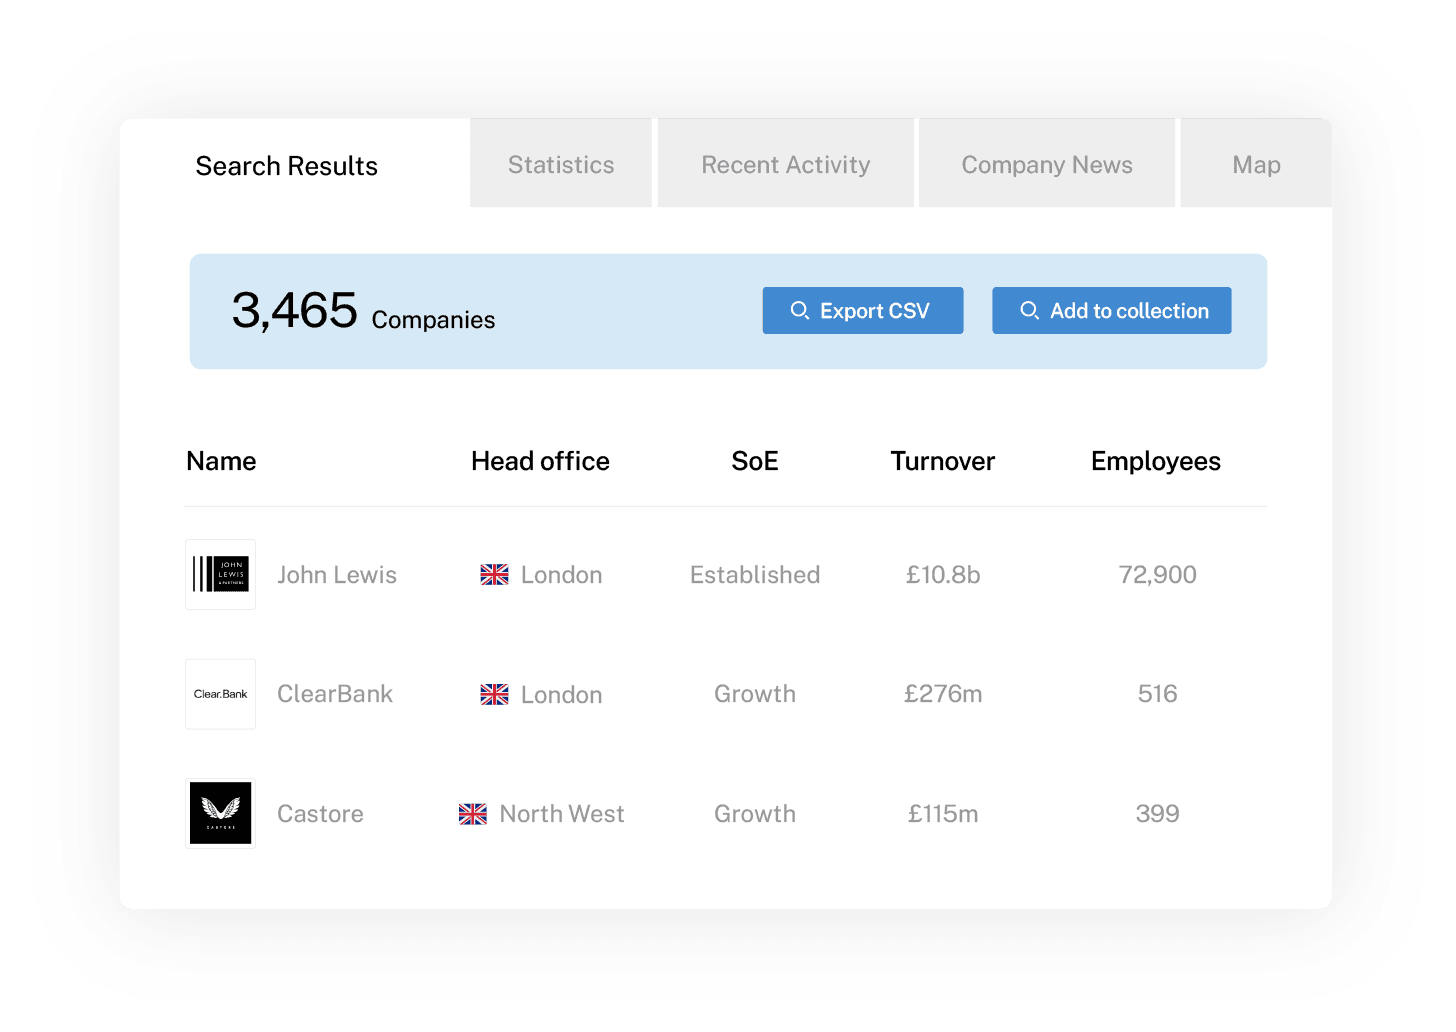
Creating this picture manually can require combining information from dozens of sources. Beauhurst brings data on the UK’s private company ecosystem together in one place, providing a common foundation for regional analysis.
Every UK private company in one dataset: the full ecosystem universe in view
Rather than beginning with a hand-built list of prominent startups, teams can start from the wider private company population and narrow it using criteria relevant to their region and objectives.
This helps reduce selection bias and surface companies that haven’t yet drawn significant media or investor attention.
Regional filters and geographic search
Geographic search enables users to identify businesses within specific areas and build company populations aligned with the region they are studying. It supports everything from Local Enterprise Partnership analysis to combined authority and university mapping.
Live industry classification and buzzwords for cluster identification
Detailed industry classifications and buzzwords help teams look beyond broad sectors and identify emerging areas of specialisation. That’s particularly useful when mapping technologies and markets that are poorly represented by traditional industry classifications.
Funding, growth, and outcome data at company level
Company-level fundraising, financial, and growth information makes it possible to move beyond startup counts and investigate how businesses within the ecosystem are developing.
Tracking exits and other company outcomes also provides a more balanced view of ecosystem performance.
University spinout, Innovate UK grant, and Research and Development tax credit tracking
Innovation indicators can help identify companies connected to universities, government support, and Research and Development activity.
For universities and public-sector organisations, these provide another way of understanding where innovation is taking place and how companies progress afterwards.
Custom Collections and refresh workflows for continuous monitoring
Once the relevant company universe has been identified, custom Collections can be used to maintain groups of businesses and revisit them as new information becomes available.
This shifts the exercise away from one-off mapping and towards continuous ecosystem intelligence.
BeauhurstImpact (the product line built for government, universities, and regional bodies)
BeauhurstImpact regional mapping gives universities, government organisations, and regional bodies a data foundation for understanding the companies, investment, and innovation activity within their ecosystems.
Rather than piecing together Companies House records, funding announcements, grant databases, and individual company research every time a report is required, teams can build and maintain a repeatable picture of their region.
That can support combined authority ecosystem intelligence, university strategy, programme evaluation, inward investment, and reporting to funders and central government.
Where to begin
A startup ecosystem map works best as a living dataset, not a one-off report. Start by defining your boundary and building the company universe. Once that’s in place, layer in funding, growth, and innovation data, map the enablers around it, and benchmark against peer regions.
With a consistent methodology and reliable company data, regional bodies can move away from expensive one-off snapshots and towards an intelligence function that develops alongside the ecosystem itself, spotting emerging clusters earlier and providing stronger evidence of what’s actually driving regional growth.