The Greater Manchester county profile scores every active company in the county together, on the same four pillars and the same UK benchmark as each local authority.
That works out as the average of its authorities' scores, weighted by their active companies, so a large authority counts for more than a small one. With more companies than any one authority, its likely range is narrower too.
Each dot shows the pillar score on a scale where the UK as a whole scores 1,000, marked by the line. The paler band is the likely range. The composite weights Innovation, Scaling and Investment 30% each and ESG 10%.
- Innovation 30%975Below average county-wide
- Scaling 30%990Below average county-wide
- Investment 30%965Average county-wide
- ESG 10%968Well below average county-wide
800UK 1,0001,700+ Want to learn more about the scores? Speak to an expert
Pillar breakdown
How Greater Manchester's score of 976 is built up.
800UK 1,0001,700+
−25 points against the UK · Likely range 971–979 · 30% of the composite
Innovation scores 975 across Greater Manchester, ranking 35th of 51 counties.
The 5 measures behind this pillar
Patents25%
Granted patent families filed in the last 20 years, held anywhere in the corporate group (capped, log scale).
Academic spinouts25%
Whether the company is a university spinout.
R&D grant value25%
Value of R&D grants received in the last five years: Innovate UK, EU programmes and other grants for R&D (capped, log scale).
Innovative sectors15%
Tagged with any industry or buzzword on a curated list of innovative sectors, for example chips, biotechnology, quantum, AI, data, SaaS, FinTech and CleanTech. About 2.5% of companies.
IS-8 sectors10%
Tagged with any of the eight IS-8 sectors: advanced manufacturing, clean energy, creative industries, digital and technologies, financial services, life sciences, professional and business services, and defence. About 18% of companies.
We publish a score for each pillar, not for the measures inside it. The percentage beside each measure is how much it counts towards the pillar score.
800UK 1,0001,700+
−10 points against the UK · Likely range 985–995 · 30% of the composite
Scaling scores 990 across Greater Manchester, ranking 33rd of 51 counties.
The 3 measures behind this pillar
Scaleups45%
Whether the company is a 20% scaleup (Beauhurst high-growth signal).
Headcount growth45%
Annualised three-year employee growth rate over the latest four years of accounts, including group accounts, for companies with five or more employees at the start (capped). All other companies count as zero.
Accelerator10%
Whether the company has attended an accelerator.
We publish a score for each pillar, not for the measures inside it. The percentage beside each measure is how much it counts towards the pillar score.
800UK 1,0001,700+
−35 points against the UK · Likely range 959–971 · 30% of the composite
Investment scores 965 across Greater Manchester, ranking 25th of 51 counties.
The 3 measures behind this pillar
Equity raisers40%
Whether the company raised equity in the last five years.
Equity raised40%
Amount of equity raised in the last five years (capped, log scale).
First-time raisers20%
Whether the company's first equity deal ever was in the last five years. A first-time raiser always counts as an equity raiser too.
We publish a score for each pillar, not for the measures inside it. The percentage beside each measure is how much it counts towards the pillar score.
800UK 1,0001,700+
−32 points against the UK · Likely range 964–972 · 10% of the composite
ESG scores 968 across Greater Manchester, ranking 48th of 51 counties.
The 5 measures behind this pillar
Clean energy30%
Active in clean or renewable energy, or clean technology.
Other green activity20%
Active in green buildings and infrastructure, green transport, or sustainable farming and food.
Environmental accolades20%
Has an environmental accolade, including completed Innovate UK clean growth grants.
Social and governance15%
Has a gender pay equality signal from a report in the last five years, a director gender equality signal, or a social accolade.
Not-for-profit proxy15%
Is limited by guarantee without share capital, a rough indicator of non-profit status.
We publish a score for each pillar, not for the measures inside it. The percentage beside each measure is how much it counts towards the pillar score.
Compared to the UK counties
Greater Manchester is ranked 32nd of 51 counties by Local Growth Score.
- City of London1,414
- Oxfordshire1,168
- Cambridgeshire1,149
- Bristol1,092
- Rutland1,044
- Greater London1,021
- Cornwall1,020
- Gloucestershire1,017
- Northern Ireland1,012
- Tyne and Wear1,011
- Berkshire1,004
- Surrey1,002
- Hampshire1,000
- Warwickshire999
- Cheshire998
- Norfolk996
- Somerset996
- Northumberland996
- Wales996
- West Sussex995
- Devon993
- Buckinghamshire992
- Scotland992
- Wiltshire989
- North Yorkshire989
- Nottinghamshire987
- East Sussex987
- Hertfordshire984
- Worcestershire983
- Durham982
- South Yorkshire981
- Greater Manchester976
- Dorset974
- Suffolk974
- West Yorkshire974
- Isle of Wight970
- Leicestershire969
- East Yorkshire969
- Derbyshire968
- Staffordshire968
- Cumbria968
- Herefordshire967
- Kent967
- Northamptonshire965
- Shropshire961
- Merseyside961
- Lancashire960
- Essex956
- Lincolnshire955
- West Midlands954
- Bedfordshire951
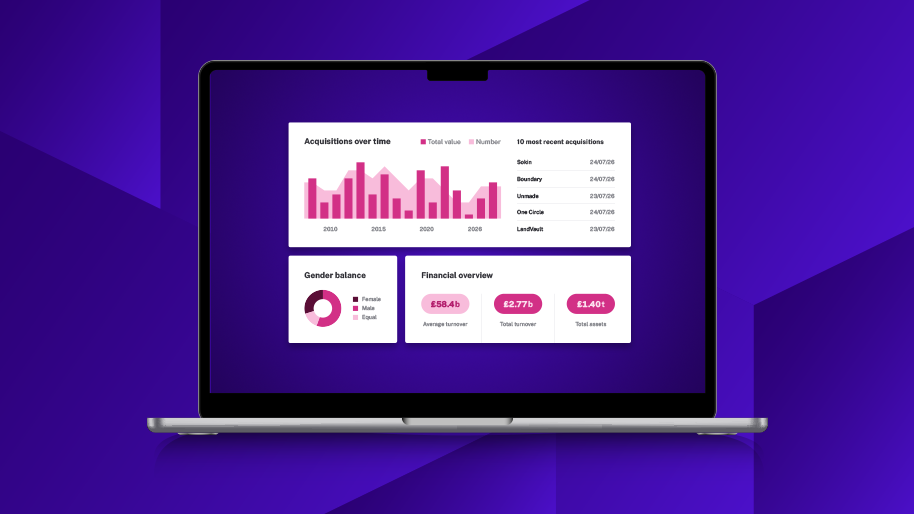
Explore the data behind the index
Every score on this page is built from real, named company activity, patent filings, fundraisings, spinouts and scaleups. Book a call to see the data behind any authority's score, and how Beauhurst can support your work.
Book a call with Beauhurst 